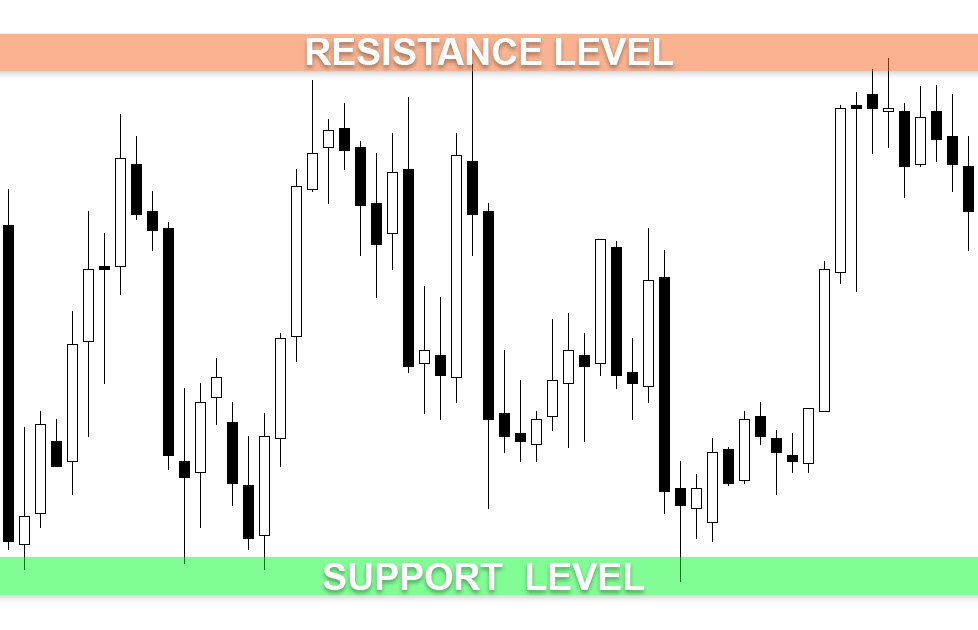
Support and resistance is one of the most commonly used concepts in the Forex trading. However, most traders have their own way of measuring support and resistance. Many a times, it can lead to false estimations, which can in turn affect business. So it is important to understand how to read charts and indications to understand when a support is an actual support and not a market tested one and the same applies for resistance.

Copyright : dolgachov / 123RF Stock Photo
What is support and resistance?
To understand the concept of support and resistance think of a zigzag line heading upwards. Every time the line heads up, it signifies a bull market, and after every surge it is bound to be drawn back, hence the zigzag pattern. The top crest of the zigzag pattern shows the resistance, when forex reaches this point it faces resistance and goes back down. The downward troughs signify support, when forex reaches the point; the market pushes its way upwards. That’s how the forex market keeps oscillating between the two points, forming support and resistance continuously.

How to identify support and resistance?
You cannot identify support and resistance levels by numbers, as they are not exactly numbers. A better way of looking at them is using candlestick charts. People some times confuse market tested support and resistance levels with the actual ones. The trick here is to look at the market trends closely and decide on the levels based on that. You can make out the tested levels by seeing the shadows of the candlesticks in the candlestick charts.
You can guess if the market is really breaking support or if it is testing it by looking at the series of candlestick shadows on the x-axis. You can know if either resistance or support is truly broken by seeing the candlesticks actually crossing over the X-axis, instead of just the shadows of them. It is just an indicator of the two components being actually broken as there is still no foolproof method of determining whether the support or resistance was actually broken or not.
Many a time, even if the candlesticks move past the X-axis, they may jump back above it quickly or at least eventually. The again does not indicate an actual breaking of support. If you were to base your idea on the fact that the candlesticks past X-axis refer to a real breakout and you were to sell your forex, then you could have hit some serious loss.
How to avoid false breakouts?
The only way you can avoid false breakouts in such a market test or the case mentioned earlier is by thinking of support and resistance more as zones rather than just numbers. Zones help you see the graph as a larger picture than just points cutting across the axis thus giving you a clearer and better idea of if the breakout is real or fake. A line chart is preferable in the case of the candlesticks chart. Line charts enable you to look at closing prices rather than adding the highs and lows to the picture. The extreme nature of these highs and lows can lead investors to go into the knee-jerk reaction and take hasty decisions. The line graphs allow you to draw clearly demarcated support and resistance zones. These are the areas forming the peaks and troughs in the graph.
Sometimes when the line passes through resistance, it can actually potentially become a support. The more the frequency with which price tests the levels of support and resistance without breaking it, the stronger the area becomes.


