







Technical analysis is the study of historical price data on charts in order to interpret market behaviour and plan trades. In Forex, that usually means reading a currency pair’s open, high, low and close over chosen timeframes, then looking for trends, levels and repeating patterns. The method assumes that current prices already reflect available information, that prices often move in trends, and that similar behaviour can reappear. Technical analysis does not replace risk management. It is a way of organising what the market has already done, not a guarantee of what happens next.
Updated: October 2026
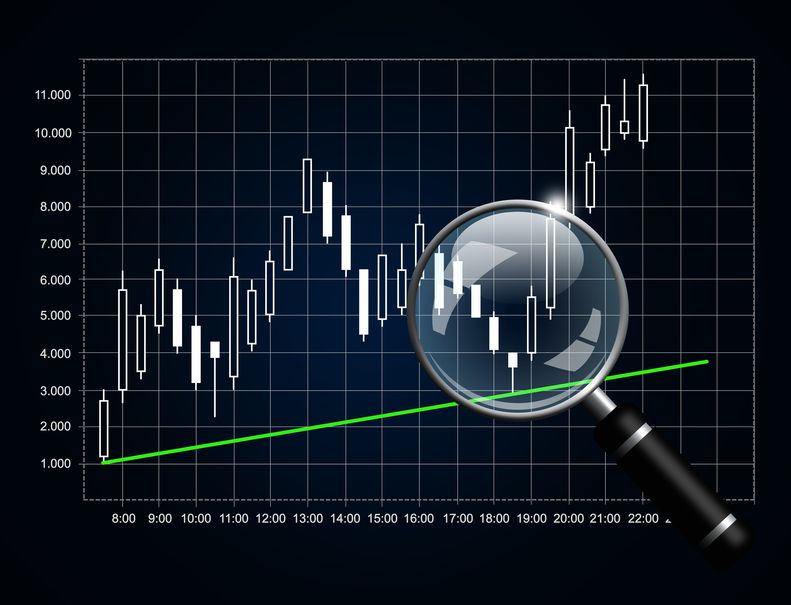
How Technical Analysis Works in Forex
A Forex chart is a time series of traded prices. Each bar or candle records where a pair traded during a period: one minute, one hour, one day, or longer. Technical analysis starts from that record. Traders mark structure on it, compare the current swing with earlier swings, and look for places where buying or selling previously stalled.
The chart does not explain why a central bank changed rates. It shows the effect: who was willing to bid the pair higher, who was willing to offer it lower, and how far that struggle ran. For short-term decisions, that effect is often more immediate than a full economic model.
Most retail platforms include drawing tools, moving averages and oscillators. Those tools are optional. The core of technical analysis is still price relative to recent highs, lows and the path between them. Indicators are derived from the same OHLC data; they do not add information that is not already in the tape.
The Three Assumptions Behind Technical Analysis
Classic technical analysis rests on three working assumptions. They are not laws of physics. They are a framework for reading charts consistently.
Price discounts available information
Once news, positioning and expectations hit the market, they show up in the last traded price. A technical reading therefore starts with the chart rather than with a separate forecast of GDP or inflation. That does not mean news is irrelevant. It means the analyst treats the price reaction as the primary evidence. A “good” data print that the pair sells off on is still a sell-off on the chart.
Prices often move in trends
If there is no idea of direction, chart work collapses into noise. An uptrend, downtrend or range is a description of how successive peaks and troughs are arranged. Traders who use technical analysis usually try to align with that arrangement rather than fight it. The dedicated guide to types of trends in Forex covers higher highs, higher lows and sideways markets in more detail.
Past behaviour can repeat
Crowds react to similar gains and losses in similar ways: hesitation after a sharp run, a second test of a broken level, a pause before a continuation. Chart patterns and candlestick shapes are shorthand for those repeats. History does not copy itself pip for pip. The assumption is only that familiar structures are worth watching, not that they always complete.
Technical Analysis vs Fundamental Analysis
Fundamental analysis asks what a currency should be worth given interest rates, inflation, growth and policy. Technical analysis asks what the market is doing with that information on the chart. Both are used in Forex trading. They answer different questions.
A fundamental view might expect a currency to strengthen because real yields are rising. A technical view then looks for whether the pair has already started that move, whether it is still compressed in a range, or whether it has stretched so far that a pullback is the more immediate risk. Neither view is a substitute for the other. Many traders use fundamentals for bias and technicals for timing. Others stay almost entirely on the chart, especially on intraday trading styles where a single data release is already in the candle.
The practical contrast is speed and subjectivity. Economic data arrive on a calendar; charts update with every tick. Chart patterns, however, are judged by eye. Two traders can draw different trendlines on the same EUR/USD daily chart and both defend the drawing. Fundamentals have their own disputes, but the inputs are at least published. Technical analysis is faster to apply and easier to overfit.
Price Charts Are the Core Tool
Without a chart there is no technical analysis. Line charts plot closing prices. Bar charts add the open, high and low. Candlestick charts show the same OHLC data as a body and wicks, which makes the distance between open and close easier to see at a glance. The companion guide to types of charts explains each format and how timeframe choice changes what you see.
The same market can look trending on a daily line chart and messy on a five-minute candle chart. That is not a defect in the method. It is a reminder that “the trend” is timeframe-specific. A swing trader may ignore the five-minute noise. A scalper may ignore the daily picture until it conflicts with a short-term setup. The data source is the same; the aggregation is not.
A trading platform lets you switch type and period without changing the underlying quotes. The analysis still has to name the period. “EUR/USD is in an uptrend” is incomplete until you say on which chart.
Trends, Then Levels
After the chart type, the next practical question is direction. An uptrend is a sequence of higher highs and higher lows. A downtrend is lower highs and lower lows. A range is a market that keeps failing near similar highs and holding near similar lows. Those labels matter because they change what a bounce or a break is likely to mean.
Trend-following approaches try to join pullbacks in the prevailing direction. Range approaches try to fade moves into the edges. Mixing the two without noticing the structure is a common source of losses: buying every dip in a downtrend, or selling every rally that is still printing higher lows. Trend identification is covered on its own page so this pillar can stay on the broader method.
Once direction is described, traders mark support and resistance: prior swing highs and lows, round numbers, and zones where price stalled more than once. Support is a price area where buying previously appeared. Resistance is an area where selling previously appeared. Those zones are not walls. They are places to watch for a reaction, a pause, or a break. The dedicated support and resistance guide is the place for how those levels are drawn and tested. Here it is enough to say that most technical plans need both a trend context and a level.
Indicators, Oscillators and Price Action
Indicators summarise price. A moving average smooths closes. RSI and stochastic oscillators scale recent gains against recent losses. MACD compares two moving averages. None of them predicts the next tick. They describe the recent path in a different visual form.
Price action traders skip most overlays and read candles, wicks and structure directly. Indicator traders wait for a cross, a divergence, or a reading in an overbought or oversold zone. Both groups are still doing technical analysis. The risk is treating an indicator as independent confirmation when it is calculated from the same candles you already see.
A workable rule is to pick a small toolkit and keep it stable: candlesticks, two horizontal levels, and one moving average for trend context. Changing indicators after every losing trade makes it impossible to know whether the method failed or the settings did.
Worked Example: A Support Bounce With Position Size
The figures below are illustrative. Pip value, margin and execution depend on the pair, account currency and the broker’s specifications.
Suppose EUR/USD is in a short-term uptrend on the hourly chart. A prior swing low sits near 1.0800. Price pulls back and a bullish hourly candle closes at 1.0810 after wicking to 1.0802. A trader treats 1.0800 as nearby support and considers a long position at 1.0810.
The invalidation level is placed below the wick, at 1.0780: 30 pips of risk. The first target is a prior swing high at 1.0870: 60 pips of potential reward if the level is reached. The account is $3,000. The trader is willing to risk 1% of equity, or $30, if the stop is hit.
On many USD-quoted major pairs, a 0.10 lot (a mini lot) has an approximate pip value of $1. A 30-pip stop then risks about $30, which matches the 1% cap. Lot size is explained in the guide to what a lot is in Forex.
| Item | Illustrative figure |
|---|---|
| Pair and entry | EUR/USD at 1.0810 |
| Stop / target | 1.0780 / 1.0870 |
| Distance | 30 pips risk, 60 pips reward |
| Position size | 0.10 lot (10,000 EUR) |
| Approx. pip value | $1 per pip |
| Stop-hit P/L | About −$30 |
| Target-hit P/L | About +$60 |
| Notional value | About $10,810 |
| Approx. margin at 1:30 | About $360 |
Leverage of 1:30 does not make the trade safer. It only changes how much balance is locked as margin. The market exposure is still 10,000 euros. Spread and slippage are ignored in the table; both reduce the realised result relative to the raw pip count.
If the bounce fails and EUR/USD closes back below 1.0800, the technical idea is wrong regardless of the economic calendar. The stop exists because the chart can invalidate the reading. Technical analysis without a defined invalidation is just a narrative.

Timeframes and How Traders Use Them
Higher timeframes filter noise. Lower timeframes add detail and more false breaks. A common workflow is to read daily or H4 for direction, then drop to H1 or M15 for an entry near a level. Scalpers reverse that: they trade M1–M5 structure and only glance at the higher chart when it clearly conflicts.
There is no universally correct period. A 200-pip daily swing and a 15-pip five-minute spike can both be “trends” on their own charts. Position size should follow the stop distance on the chart you actually trade. A 15-pip stop on M5 and a 150-pip stop on daily are different risks even if both use 0.10 lots. That is why technical levels and Forex risk management have to be calculated together.
News still punches through technically clean levels. A support zone that held for a week can fail in seconds around a rate decision. Chart readers who trade through the calendar accept that extra gap and slippage risk. Others stand aside until the candle that contains the release has closed.
Strengths and Limits of Technical Analysis
The main strength is that the same process can be applied to EUR/USD, gold or an index future: find structure, define risk, size the position. Charts are available on every serious platform. Decisions can be made without building a full macroeconomic model. For beginners, that accessibility is useful, provided it is not mistaken for simplicity.
The main limit is subjectivity. Trendlines can be redrawn after the fact. Patterns are clearer in textbooks than in live markets. Two honest analysts can disagree on whether a break is real. Technical analysis also cannot prevent a weekend gap or a thin-liquidity spike.
Another limit is sample size. A pattern that “worked” five times on one pair is not a tested edge. Historical charts invite hindsight: the eye remembers the shapes that succeeded and forgets the similar ones that failed.
|
|
 Broad applicability: The same analytical process can be applied to currency pairs, gold, indices and other financial markets.
 Subjectivity: Trendlines, chart patterns and breakouts can be interpreted differently by different traders.
Using Technical Analysis With a Broker and a Plan
Charting quality depends in part on the feed and the contract you trade. CFDs from different types of Forex brokers can print slightly different highs and lows around the same event. The method still applies, but levels should be taken from the platform you will order on, not from an unrelated screenshot.
Choosing where to trade is a separate decision from choosing a chart pattern. Regulation, execution, costs and withdrawal terms belong in a broker review process such as how to choose a Forex broker. Technical analysis does not repair a poorly specified account. It also does not replace a written rule for how much of the balance is at risk on one idea.
A complete technical plan names the pair, the timeframe, the invalidation price, the order size, and what would cancel the idea before entry. If those items are missing, the chart is being used as decoration.
Trading CFDs and Forex with leverage can result in losses that exceed the deposit. This page is educational and is not investment advice. Figures in the examples are illustrative and should be checked with the broker before they are used on a live order.
Frequently Asked Questions About Technical Analysis
What is technical analysis in Forex?
Technical analysis in Forex is the study of historical prices on charts in order to describe trends, levels and patterns and to plan trades from that structure.
How is technical analysis different from fundamental analysis?
Fundamental analysis focuses on economic and policy drivers of a currency. Technical analysis focuses on how price has already moved on the chart. Many traders use both; they are not mutually exclusive.
Do technical indicators guarantee profitable trades?
No. Indicators are calculations of past prices. They can organise information, but they do not remove market risk or guarantee a future move.
Which chart type is used most in Forex technical analysis?
Candlestick charts are the most widely used because they show open, high, low and close in one graphic. Line and bar charts remain useful for a cleaner view of direction or range.
What timeframe should I use for technical analysis?
There is no single correct timeframe. Higher periods show broader structure; lower periods show more detail and more false breaks. The stop distance should match the chart you actually trade.
Can beginners use technical analysis?
Yes, as a way to read charts and define invalidation. Beginners still need position sizing and a clear risk limit. A clean pattern does not make an oversized lot safer.
Does technical analysis work on every currency pair?
The same chart tools can be applied to most liquid pairs. Behaviour still differs by pair, session and trading cost.
Should technical analysis be used with a stop loss?
A defined invalidation price is part of turning a chart reading into a plan. Stops do not guarantee an exact exit in every market condition, especially around gaps and fast news.
Summary
Technical analysis is a chart-based reading of what the market has already done. In Forex it is built on price, time, trend and the levels where price previously stalled. It is faster to apply than a full fundamental model and more subjective than a published data print.
The useful sequence is stable: choose a chart and timeframe, describe the trend, mark levels, then size the trade from the stop distance and an acceptable cash risk. Charts, trend types and support and resistance each deserve their own pages because they are the working parts of that sequence.
Treat every example pip value and margin figure as a teaching device. The live numbers sit on the broker’s platform.