




Types of charts in Forex are the graphic formats used to display a currency pair’s price over time. The three formats you will meet on almost every platform are the line chart, the bar chart and the candlestick chart. All three plot the same market. They differ in how much of each period’s open, high, low and close they show. Chart type is a display choice inside technical analysis, not a separate trading system. A line chart can make a daily trend obvious. A candlestick can show whether buyers or sellers closed a single hour. Timeframe then decides whether that picture covers five minutes or five weeks.
Updated: October 2026
What Every Forex Chart Has in Common
A chart needs two axes: time along the bottom and price up the side. Each plotted unit is one period — M5, H1, D1, and so on. For a currency pair such as EUR/USD, the vertical scale is the exchange rate. The horizontal scale is when that rate was recorded.
The underlying quotes do not change when you switch from candles to bars. You are only changing how open, high, low and close (OHLC) are drawn. Some exotic chart types exist (Renko, Heikin-Ashi, range bars), but line, bar and candlestick remain the default set on a retail trading platform.
Price is usually the bid or a mid/last print supplied by the broker. Different brokers can show slightly different wicks around the same spike. Read the chart you will order from, not a screenshot from another feed, if you are marking a specific high or low.
Open, High, Low and Close (OHLC) Explained
OHLC is a compact record of what happened to price during one chart period. The open is the first price recorded for that period, the high is the highest price reached, the low is the lowest price reached, and the close is the final price used to form the period. A line chart normally keeps only the close, while bars and candlesticks show all four values.
The relationship between open and close tells you whether the period finished higher or lower than it started. It does not show the exact path price took between those points. For example, a bullish candle may still contain a sharp drop before buyers recover, while a bearish candle may have rallied strongly before sellers pushed it lower. The high and low help reveal that intraperiod movement.
Line Charts
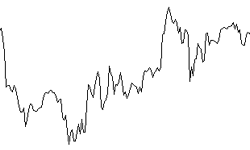
A line chart connects closing prices. Intraday extremes are omitted. That is a limitation and a feature. The line answers a narrow question: where did each period finish? For spotting a broad uptrend or downtrend, that is often enough. Noise from long wicks that immediately reversed is hidden.
Because only closes are shown, a line chart is a poor tool for judging a single session’s range. You cannot see whether the pair traded 80 pips intraday and closed unchanged, or drifted 8 pips and closed unchanged. Geometric shapes such as a sequence of rising closes are easier to see. Fine detail for entries is not.
Line charts are useful as a first pass: daily or weekly closes to describe direction, then a switch to candles on a lower timeframe for the actual order. They are also easier to read when you overlay several pairs or when you want a moving average to sit on a clean close series rather than on a forest of wicks.
Bar Charts
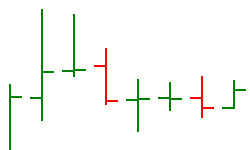
A bar (sometimes called an OHLC bar) is a vertical line from the period’s low to its high. A short tick on the left marks the open. A short tick on the right marks the close. One bar therefore contains the full range of that period, not only the close.
If the right tick sits above the left tick, the period closed higher than it opened. If the right tick sits below the left tick, it closed lower. Platforms often colour the up bars and down bars differently so that direction is visible without reading each tick.
Bar charts show the same information as candlesticks. They are slightly less “filled in,” which some traders prefer on dense timeframes. They are also the historical Western format that pre-dated the wide use of Japanese candles in retail Forex. If you can read a bar, you can read a candle, and the reverse.
Candlestick Charts
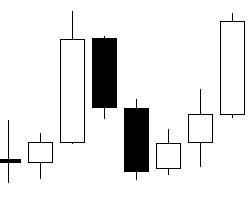
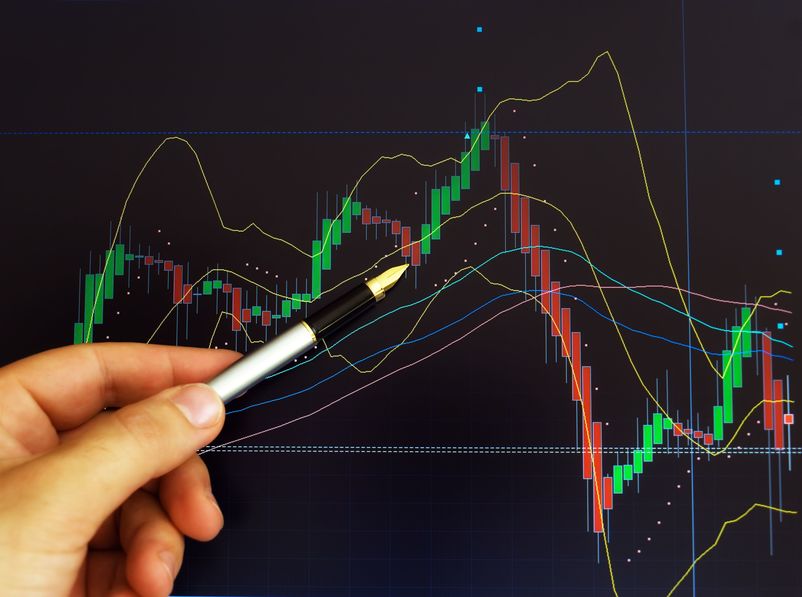
Candlestick charts plot the same OHLC data as bars, with the distance between open and close drawn as a rectangle (the body) and the extremes drawn as thin lines (the wicks or shadows). A close above the open is typically a hollow or green/white body. A close below the open is typically a filled or red/black body. Colours are a platform setting, not a market rule.
The body shows conviction between the start and end of the period. The wicks show rejection or exploration beyond that range. A long lower wick and a close near the high says sellers pushed the pair down and buyers recaptured most of the move before the period ended. A long upper wick and a close near the low says the opposite. A small body with long wicks both ways says the period was a tug of war that ended near where it began.
Japanese rice traders used candle charts centuries ago. Western retail platforms adopted them widely from the 1990s because the body makes direction faster to scan than left/right ticks on a bar. Candles did not add a new data field. They changed the graphic.
Single-candle labels (hammer, shooting star, doji) describe shape. They are not orders. A hammer at the wrong place in a trend is just a bar with a lower wick. Context from neighbouring candles and from the higher timeframe matters more than the nickname.
When Each Chart Type Is Most Useful
A line chart is often the clearest choice when the main question is whether closing prices are generally rising, falling or moving sideways. An OHLC bar is useful when you want the full range but prefer a compact display. Candlesticks are a practical default when you want to compare the open, close and extremes quickly. There is no chart type that is best for every task; the choice depends on which information you need to see.
For example, someone reviewing a weekly trend may start with a line chart to reduce visual clutter, then switch to daily or hourly candles to inspect possible entry and exit areas. A trader analysing a narrow intraday range may prefer bars or candles because the highs and lows can matter even when the closing prices barely move. In both cases, changing the display does not create a new price signal; it changes how the same data are presented.
Line vs Bar vs Candlestick
| Chart type | Data shown | Typical use |
|---|---|---|
| Line | Close only | Trend overview, less noise |
| Bar (OHLC) | Open, high, low, close | Full range without a filled body |
| Candlestick | Open, high, low, close | Same OHLC, faster to scan visually |
Switching type can change what your eye notices, not what the market did. A messy candle chart can look like a smooth uptrend once only closes are plotted. That can be clarifying or misleading. If the wicks keep tagging a level the close never holds, the line chart will hide the tests. If you care about those tests, use bars or candles.
For most active Forex work, candlesticks are the default. Keep a line chart available when you want to judge types of trends from closes alone. Use whichever format you can read without hesitation. Speed of reading matters more than loyalty to one graphic.
A Quick Guide to Common Forex Timeframes
The timeframe label tells you the duration represented by each bar or candle. M1 represents one minute, M5 five minutes, M15 fifteen minutes, H1 one hour, H4 four hours, D1 one day, W1 one week and MN1 one month. On a line chart, each point usually represents the closing price for the selected interval. Check the platform’s labels because some chart types, such as range or Renko charts, are built using different rules.
A candle is not complete until its period ends. Its open is set at the beginning, but the high, low and close can keep changing while the candle is forming. A currently green candle can turn red before the hour ends, depending on the platform’s colour settings and the final close. For a consistent comparison, distinguish completed candles from the live candle at the right edge of the chart.
Timeframes: What One Candle Represents
Timeframe is independent of chart type. An H1 candlestick compresses 60 minutes of ticks into one OHLC. A D1 bar compresses a session. An M5 line point is a single five-minute close. The same EUR/USD market therefore has many simultaneous charts.
Trading styles tend to cluster on certain periods. Scalping often uses M1–M5. Day trading often uses M15–H1. Swing trading often uses H4–D1. Position trading often uses D1–W1. Those pairings are conventions, not rules. A swing idea can still be executed with an H1 order once the daily structure is clear.
Lower timeframes print more candles and more contradictory shapes. Higher timeframes print fewer decisions and wider stops in pip terms. A 20-pip H1 stop and a 120-pip daily stop are different cash risks at the same lot size. Match position size to the stop on the chart you trade, using risk management rather than the most zoomed-in picture that still looks tradable.
A practical habit is to fix one higher timeframe for direction and one lower timeframe for execution, then leave them alone for a stretch of trades. Constantly switching from M5 to H4 mid-trade is a way of finding a chart that agrees with the open position.
Worked Example: Reading One EUR/USD Hourly Candle
The figures below are illustrative. Spreads, exact pip value and margin depend on the broker, account currency and contract specification.
Consider one H1 candlestick on EUR/USD:
| Field | Price | Notes |
|---|---|---|
| Open | 1.08420 | Start of the hour |
| High | 1.08580 | Upper wick to here |
| Low | 1.08340 | Lower wick to here |
| Close | 1.08540 | End of the hour |
The body runs from 1.08420 to 1.08540: 12 pips of net buying between open and close. The upper wick is 1.08580 − 1.08540 = 4 pips. The lower wick is 1.08420 − 1.08340 = 8 pips. The full range is 1.08580 − 1.08340 = 24 pips. The candle is bullish: it closed near the high after dipping first.
A line chart of the same hour would show only the close at 1.08540, connected to the previous hour’s close. You would not see the 8-pip dip or the 4-pip push above the close. A bar chart would show the same 24-pip range with left and right ticks at 1.08420 and 1.08540.
Now attach a cash example. A trader who bought 0.20 lots at the open of 1.08420 and exited at the close of 1.08540 captured 12 pips. On many USD-quoted majors, 0.20 lots is about $2 per pip, so the raw move is about $24 before spread. The same size stopped out at the low of 1.08340 would be 8 pips against the long, or about −$16, still ignoring spread.
Notional size of 0.20 lots of EUR is 20,000 euros. At 1.08420 that is about $21,684. At 1:30 leverage, illustrative margin is about $723. Leverage does not change the $2-per-pip exposure. It only changes how much balance is posted as margin. A one-hour candle can still move 24 pips; at 0.20 lots that is about $48 peak-to-trough in this example.
One candle is a description of one period. It is not a forecast of the next hour. Traders who treat a single bullish body as a signal without a plan for invalidation are reading a picture, not managing a position. A demo account is a place to practise reading OHLC without cash risk, provided the demo spread resembles the live book you would actually trade.
How Chart Choice Affects Long and Short Decisions
A long or short order is placed on the rate, not on the graphic. The chart only helps you decide where that order sits relative to recent OHLC. If you cannot see the high and low, you cannot place a stop beyond them with much confidence. That is the main argument for bars or candles over a close-only line when you are about to click buy or sell.
Session opens matter on some pairs. A Sunday gap on the daily candle can look like a huge wick or an empty space depending on how the platform builds the bar. Know whether your broker’s daily candle closes at 21:00, 22:00 or 23:59 server time. Two “daily” charts from two servers are not the same object.
Costs still sit outside the picture. Spread, commission and overnight financing are not drawn on the candle. A 4-pip body that looks decisive can be mostly spread on a wide pair. Chart reading without a cost check overstates what the body is worth.

Common Chart-Reading Mistakes
One common mistake is treating a candle’s colour as a prediction. A bullish candle only tells you that the selected period closed above its open under the platform’s displayed price convention. It does not prove that the next candle will rise. The same applies to bearish candles and familiar patterns: they describe price action and need context before they can inform a trading decision.
Another mistake is comparing candles from different timeframes as though they represent the same amount of trading activity. A long H4 candle covers four hours, while a long M5 candle covers only five minutes. Compare each move with its own timeframe and recent price behaviour instead of judging candle size alone.
Traders can also overlook differences between price feeds. Small differences in spreads, quote sources and server time may affect the shape of a candle or the location of a session high and low. This matters most when a trade plan relies on an exact level. Use the broker’s own chart and verify trading costs and order conditions before placing a live trade.
Practical Habits That Keep Charts Honest
Pick one type as the working default. Candlesticks are the usual choice in Forex. Use the line chart when you want to mute wicks. Avoid stacking Heikin-Ashi, Renko and candles on the same idea unless you know how each is built; mixed types make it easy to “confirm” a move that is only a smoothing artefact.
Keep the scale honest. Auto-zoom that fills the screen with a 12-pip range makes a quiet hour look like a trend. A log scale is rarely needed for a spot FX pair that already lives in a tight band. Note the pip height of the window before you draw conclusions.
Save templates rather than rebuilding colours every session. If bullish candles are green on Monday and white on Tuesday, you will misread them when you are tired. The market did not change; the legend did.
Broker quality still matters for the quotes you plot. Spreads, fills and the right to withdraw funds are not chart settings. They belong in how you choose a Forex broker. A precise candle on a poor book is still a poor place to trade.
Trading CFDs and Forex with leverage can result in losses that exceed the deposit. This page is educational and is not investment advice. Figures in the examples are illustrative and should be checked with the broker before they are used on a live order.
Frequently Asked Questions About Types of Charts
What are the main types of charts in Forex?
The three main types of charts in Forex are line, bar (OHLC) and candlestick. They display the same market with different amounts of open, high, low and close detail.
What is the difference between a bar chart and a candlestick chart?
Both show open, high, low and close. A bar uses left and right ticks for open and close. A candlestick uses a body for that same distance and wicks for the extremes.
Why do traders prefer candlestick charts?
The filled or hollow body makes it faster to see whether a period closed up or down and how large that move was relative to the wicks. The data are the same as on a bar chart.
What timeframe should I use?
Use a higher timeframe for direction and a lower one for execution if you need both. There is no universal setting. Stop distance in pips should match the chart you actually trade.
What do the wicks on a candlestick mean?
Wicks mark the high and low of the period beyond the open–close body. A long wick shows that price traded there and then reversed before the period closed.
Can I switch chart types on a trading platform?
Yes. Most Forex platforms let you change line, bar and candlestick views without changing the underlying quotes. Timeframe is a separate control.
Is a line chart useful for beginners?
A line chart can make the path of closes easier to see. For placing stops beyond a period’s high or low, a bar or candlestick chart is more informative because it shows those extremes.
Does one candle tell you the next move?
No. One candle describes one completed period. It can be used as context, but it does not guarantee the next open, high, low or close.
Summary
Types of charts in Forex are display formats for the same OHLC data. Line charts show closes. Bar charts and candlestick charts show the full period: open, high, low and close. Candlesticks are the usual working view because the body is quick to scan.
Timeframe decides how much time is packed into each unit. A 12-pip hourly body is not a daily trend, and a daily line of rising closes can hide violent intraday wicks. Read the type and the period together, then size any trade from the stop distance and an acceptable cash risk – not from how dramatic the last candle looks on the screen.